
Top customer satisfaction stats from SurveyStance If your customer satisfaction survey questions are unclear or biased, test them first with the SurveyStance AI survey question checker before sending the survey.
In this article
General Customer Experience Feedback Stats and Facts
Check out some of these popular customer service statistics that will no doubt get you refocused on customer experience.
- 50% of customers said they would not spend more than 3 minutes filling out a feedback form.
- 69% of consumers prefer to use their mobile devices for providing feedback on products or services, per Google Consumer Surveys.
- 2x revenue growth Companies that prioritize customer satisfaction see revenue growth nearly double that of companies that don't. (Bain & Company)
- 70% vs 40% Almost 70% will consider leaving a review after a positive experience, while 40% will consider leaving one after a negative experience.
- 96% of consumers say customer service is an important factor in their choice of loyalty to a brand, according to a Microsoft report.
- 9 vs 16 people A customer will tell 9 people about a good experience and 16 about a negative one.
- 76% of consumers say that after more than one bad experience they would rather do business with a competitor.
- Emojis help Surveys incorporating emojis in open-ended text responses lead to more expressive and detailed feedback than traditional surveys.
Bad Customer Experience Statistics and Facts
- 32% of customers would stop doing business with a brand they love after just one bad experience.
- 9-15 people Dissatisfied customers typically tell between 9 and 15 people about their experience.
- 26 stay silent For every one customer who complains, there are 26 others who don't speak up.
- 90%+ of complaining customers will do business with you again if you resolve the complaint in real time.
Customer Satisfaction Statistics - Feedback Kiosk Stats
- 87% positive of feedback received through SurveyStance is positive.
- 1% neutral of feedback received through SurveyStance is neutral.
- 12% negative Only 12% of all feedback received through SurveyStance is negative.
- 98% of all free-text comments received were positive.
- 200+ ratings Average SurveyStance customers capture more than 200 ratings per month.
- 25x It can be up to 25 times more expensive to win a new customer than to keep an existing one.
SurveyStance Case Study - Customer Satisfaction Statistics
- 90% of court users felt the courts treated them fairly, in a pilot across 7 courts collecting feedback.
- 1,900 responses Within a 3-month period, at the height of the pandemic, these seven courts collected feedback from over 1,900 court users.
- 14% average, 34% peak On average 14% of people entering the courts provided feedback, and in some courts completion rates reached 34%.
Measuring our impact at City of Salem Public Library
Through the SurveyStance kiosk, users reported an 85.4% satisfaction rating with the service they received during the month of May. This is the highest percentage of satisfaction reported during the last 4 months of surveys. Excellent work, public services team.
Customer Satisfaction Statistics Survey Completion Rate
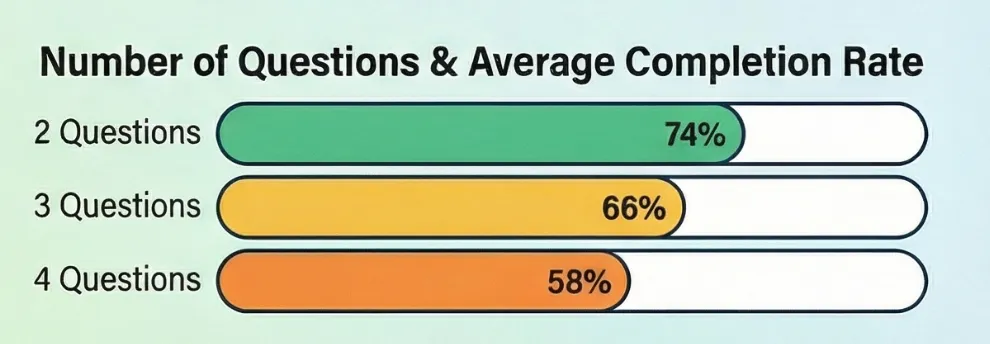
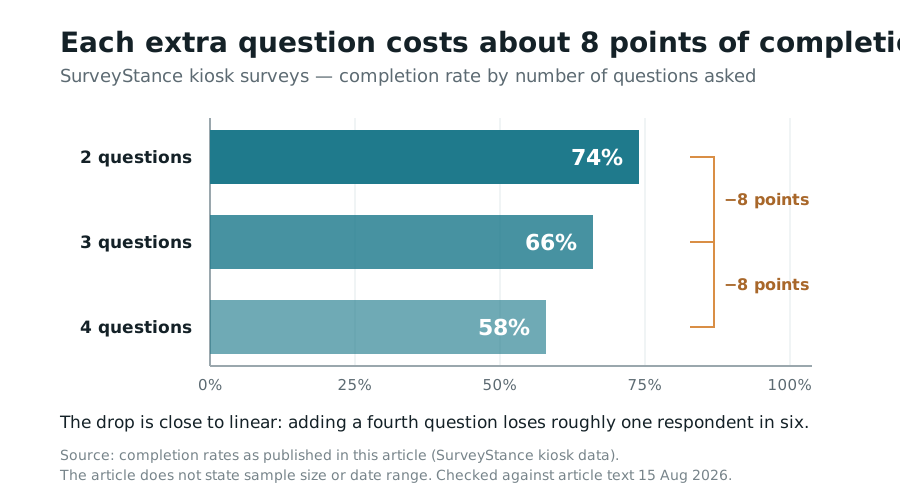
Every question you add costs you completions. Across SurveyStance kiosks the drop-off is consistent enough to plan around:
| Questions | Average completion rate |
|---|---|
| 2 questions | 74% |
| 3 questions | 66% |
| 4 questions | 58% |
Customer Experience Statistic - Graphs, Images, Charts and Infographics
Feel free to use any of our customer experience statistics and infographic images below.
Response Rates for an Employee Survey (traditional email survey link)
| Benchmark | Response rate |
|---|---|
| Low | Below 20% |
| Average | Around 50% |
| High | Over 70% |
FEEDBACK PROGRAMS
Turn this research into a live feedback program.
Compare kiosk, QR code, email signature, and OneClick feedback options built for faster response and real-time visibility.
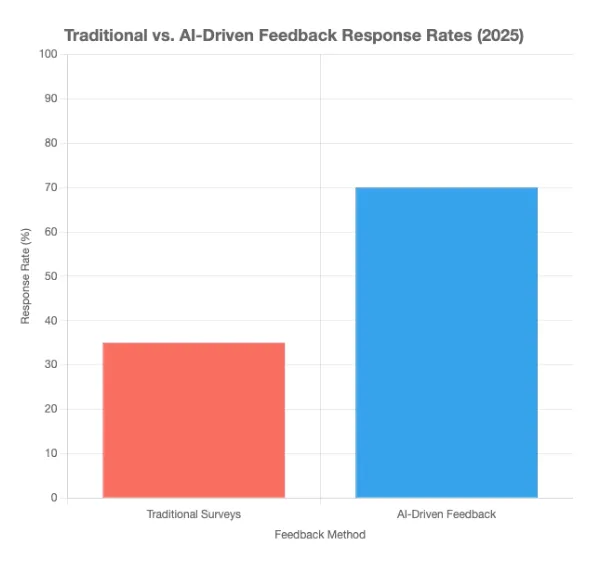
Discover AI employee feedback surveys for real-time insights in 2026. Boost employee engagement with tools like SurveyStance.

Automated customer experience tells you an interaction happened, not that it worked. Gartner found customers are 3x more likely to use ChatGPT than your chatbot.
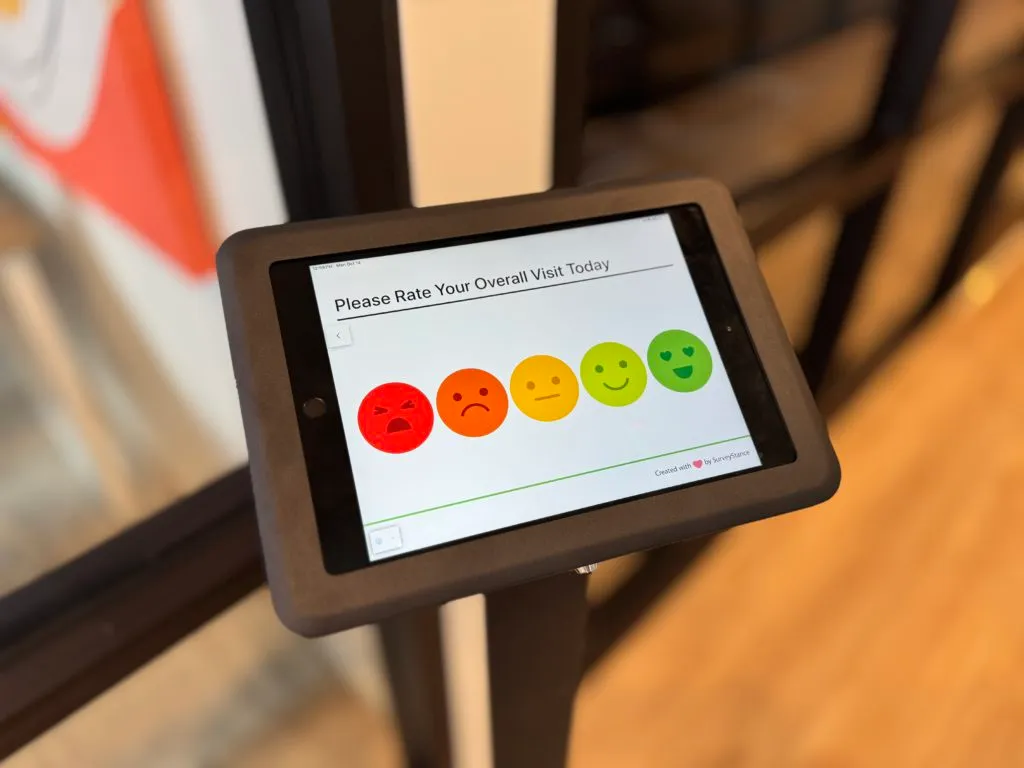
Discover the best cafeteria feedback survey solutions to gather actionable employee feedback. Improve dining experiences with a modern feedback survey kiosk.