

CSAT vs NPS comes down to one question: are you measuring a moment or a relationship?
CSAT (Customer Satisfaction Score) asks how satisfied someone was with a specific interaction, like a checkout, a support call or a clinic visit. NPS (Net Promoter Score) asks how likely they are to recommend you, which makes it a measure of loyalty to your brand as a whole. Use CSAT when you want to find and fix problems at a specific touchpoint.
Use NPS when you want one loyalty number to track over time and compare with other companies. Most teams get the most out of running both. Below, we cover how to calculate each score, what counts as a good one, where Customer Effort Score (CES) fits in and how to combine them in a single survey.
In this article
CSAT vs NPS: The Key Differences
Here's how the two metrics compare side by side.
| Comparison | CSAT | NPS |
|---|---|---|
| What it measures | Satisfaction with one interaction, product or visit | Loyalty to the brand as a whole |
| Typical question | “How satisfied were you with your visit today?” | “How likely are you to recommend us to a friend or colleague?” |
| Scale | Usually 1–5 (sometimes 1–3, 1–7 or 1–10) | Always 0–10 |
| Formula | Satisfied responses (4s and 5s) ÷ total responses × 100 | % promoters (9–10) − % detractors (0–6) |
| Result | A percentage from 0% to 100% | A score from −100 to +100 |
| Time frame | Short term: how it went just now | Long term: how they feel about you overall |
| When to ask | Right after the interaction | On a regular schedule, such as quarterly, or after a milestone |
| Best for | Pinpointing problems at a specific touchpoint | Tracking loyalty over time and benchmarking against others |
| Main weakness | Doesn't tell you whether customers will stay | Doesn't tell you what to fix |
The short version: CSAT tells you where something went wrong, and NPS tells you whether it's costing you loyalty. Neither one tells you why, which is where a good follow-up question comes in (more on that below).
What Is CSAT (Customer Satisfaction Score)?
CSAT measures how happy customers are with a specific product, service or interaction. You ask one question right after the experience, such as “How would you rate your experience with our support team today?”, and offer a short scale that runs from very unhappy to very happy.
Because it's tied to a single moment, CSAT is good at showing you where things break. If your checkout scores 90% and your returns desk scores 62%, you know exactly where to look.
CSAT surveys come in a few common formats:
- Email link surveys The most common type. The survey arrives by email after the interaction, and the customer clicks a link to answer it.
- One click surveys The first question is embedded in the email itself, so a single click records the answer. Follow-up questions on the landing page are optional. SurveyStance's OneClick email surveys work this way.
- SMS surveys Usually sent after a purchase. Customers answer text message surveys by replying with a number from 1 to 5.
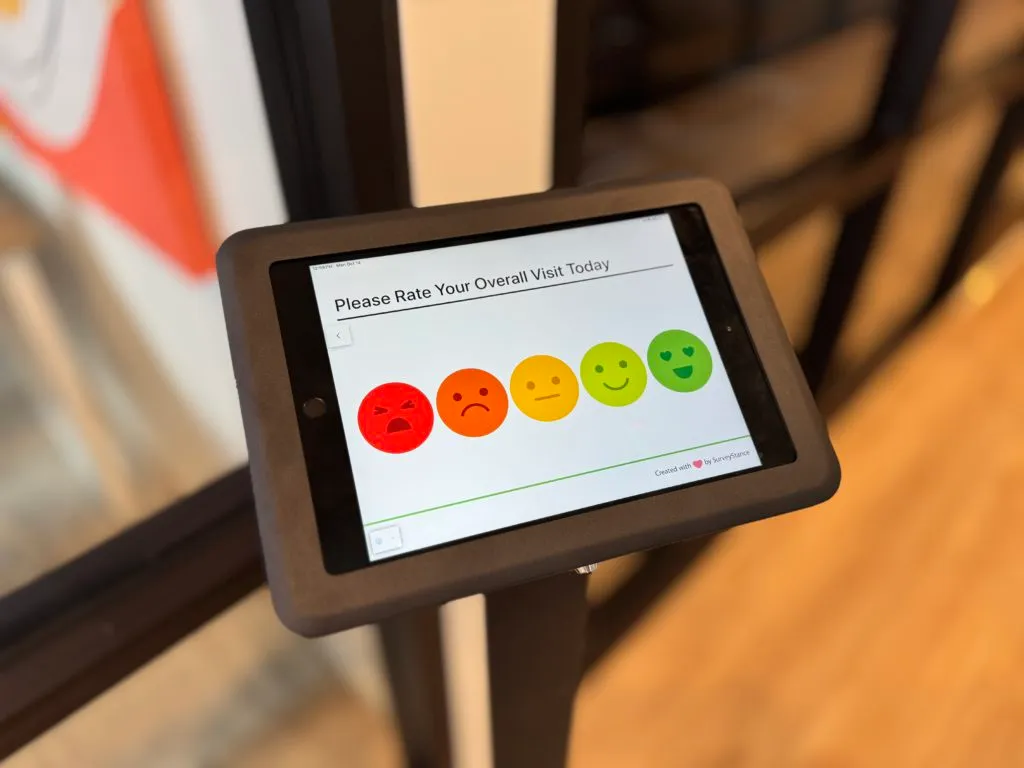
- In-person surveys A tablet-based in-person feedback kiosk or a row of smiley face feedback buttons at the exit or checkout captures the rating while the visit is still fresh.
Three reasons CSAT has stayed popular for so long:
- It pinpoints specific problems Because CSAT surveys go out after specific interactions, the results show which part of the business needs work. Many support teams send one automatically after every call.
- Everyone understands it “82% of customers were satisfied” needs no explanation in a team meeting, so the score is easy to share across the company.
- It's quick to set up and quick to answer You can add a CSAT question at any step of the customer journey, customers can answer it in seconds, and you can act on the results right away.
When it comes to online interaction, customers certainly aren't shy about letting their opinions be known, all you have to do is listen and provide them with means of expressing themselves.
CSAT has a blind spot, though. It tells you how a moment went, not whether a satisfied customer will come back. And it depends on who bothers to answer.
CSAT is a broad term that covers many questions that all try to uncover how satisfied current customers are with the product, or a particular interaction they just completed. It should be remembered that mildly satisfied or dissatisfied customers are less likely to complete your survey, thus skewing the results.
What Is NPS (Net Promoter Score)?
NPS measures customer loyalty with a single standardized question: “On a scale of 0 to 10, how likely is it that you would recommend us to a friend or colleague?” It was introduced by Fred Reichheld of Bain & Company in a 2003 Harvard Business Review article, and it's now one of the most widely used customer metrics in the world.
Because every company asks the same question on the same scale, NPS is easy to benchmark. That consistency is its biggest strength. The flip side is its biggest weakness: one number about recommending you says very little about what to change.
Where NPS works well:
- Standardized Customers recognize the question, and the method is the same everywhere.
- Easy to benchmark You can compare your score with competitors and industry averages.
- Tied to growth Bain's original research linked higher NPS to faster company growth, which is a big part of why leadership teams like it.
Where it falls short:
- No reason behind the number A 3 doesn't tell you whether the problem was price, wait time or a rude interaction.
- A wide scale Eleven options is a lot for a quick survey, and people don't agree on what separates a 6 from a 7.
- Not a fit for every setting The question assumes customers choose you, which isn't always true (more on that below).
Net Promoter®, NPS® and the NPS-related emoticons are registered trademarks of Bain & Company, Inc., NICE Systems, Inc. and Fred Reichheld.
How to Calculate CSAT and NPS
Both formulas are simple. What differs is which answers get counted.
For example, if you get 50 responses and 35 of them are a 4 or a 5, your CSAT score is 35 ÷ 50 × 100 = 70%. The most common 5-point CSAT scale looks like this:
- Very unhappy / very bad
- Unhappy / bad
- Neutral
- Happy / good
- Very happy / very good
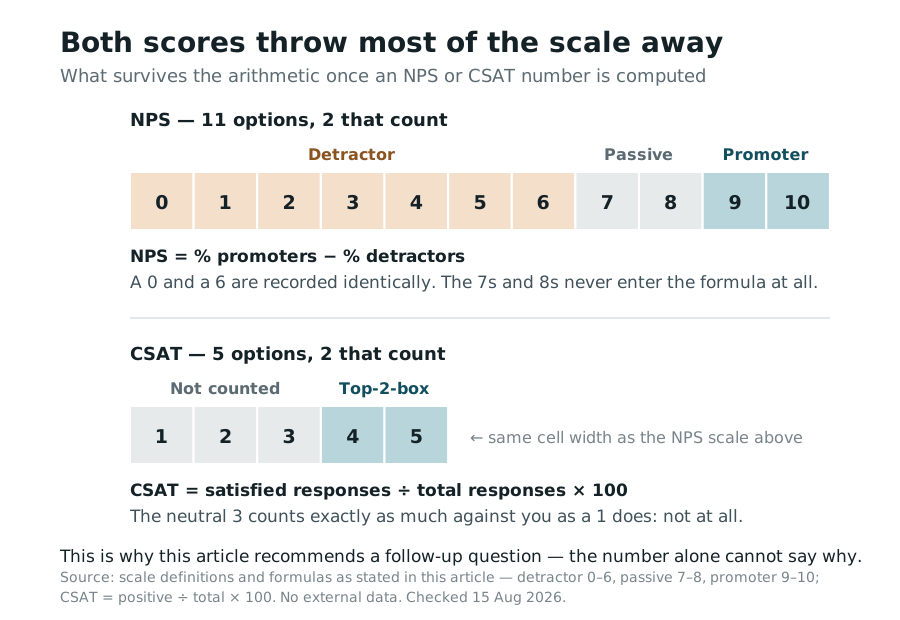
Every answer on the 0–10 scale lands in one of three groups:
- Promoters (9–10) Loyal fans who are likely to recommend you.
- Passives (7–8) Satisfied but unenthusiastic, and easy for a competitor to win over.
- Detractors (0–6) Unhappy customers who are unlikely to recommend you and may steer others away.
For example, out of 200 responses, 110 are promoters (55%), 50 are passives (25%) and 40 are detractors (20%). 55 − 20 gives you an NPS of +35. NPS is a whole number, not a percentage, and it can run from −100 (everyone is a detractor) to +100 (everyone is a promoter).
Both formulas throw information away. NPS records a 0 and a 6 the same way and leaves 7s and 8s out entirely, and top-two-box CSAT counts a neutral 3 the same as a 1.
What Is a Good CSAT or NPS Score?
A CSAT score of 80% or higher is generally considered good. It means most customers are getting what they expected. Your own trend matters more than any benchmark, though: a 78% that climbs every quarter says more than an 85% that's slipping.
Because NPS runs from −100 to +100, any score above 0 means you have more promoters than detractors. As a rough rule of thumb, above 20 is good, above 50 is excellent and above 70 is exceptional. Averages vary a lot by industry, so compare yourself with companies like yours rather than with a universal number.
One warning for both: a score is only as good as the responses behind it. If only a handful of customers answer, the number mostly reflects whoever felt strongly enough to reply. Our guide to CSAT tools covers how to fix low response rates.
Real NPS Scores: What Companies Have Published
Very few companies publish their NPS. The ones that do tend to mention it in annual reports or when they go public, which is exactly when they most want to impress. Here are scores companies have reported themselves, with the period each one covers. They aren't like-for-like: some cover one product or customer group, and a few are stated as thresholds like “above 70” rather than exact scores.
| Company | Published NPS | Who it covers | Period | Source |
|---|---|---|---|---|
| SAP | 9 | Customers | 2025 | SAP Integrated Report 2025 |
| ING | 77 | Wholesale Banking clients | 2025 | ING Annual Report 2025 |
| Telstra | +47 | Episode NPS, measured after specific interactions | Year to June 2025 | Telstra Annual Report 2025 |
| Peloton | Above 70 (Tread above 80) | Cardio hardware owners | Quarter to March 2025 | Peloton Q3 FY2025 shareholder letter |
| Wise | 66 | Customers | Year to March 2024 | Wise Annual Report 2024 |
| Warby Parker | 83 | Customers | Quarter to June 2021 | Warby Parker S-1 (2021) |
| Snowflake | 71 | Customers, via a third-party survey | May 2020 | Snowflake S-1 (2020) |
| Lemonade | Above 70 | Customers | Not stated (filed June 2020) | Lemonade S-1 (2020) |
| Chewy | 86 | Customers and website visitors surveyed | Fiscal 2018 | Chewy IPO prospectus (2019) |
| Zoom | Over 70 | Customers (average) | 2018 | Zoom S-1 (2019) |
Two things stand out. The 70s and 80s mostly come from IPO filings, written when each company was selling its story to investors. SAP's 9 comes from a software company that reports the number to shareholders every year, and it's a useful reality check on what “good” looks like at scale.
The same report says SAP is switching its customer experience metric from NPS to a cloud CSAT score in 2026, measured as the share of customers who are satisfied or very satisfied: the top-two-box method described above. When a company that has published its NPS for years decides a satisfaction score is the better one to steer by, that's a real-world answer to the CSAT vs NPS question.
CSAT vs NPS: Which Is Better?
Neither is better across the board. They answer different questions, so the right one is whichever matches the decision you need to make.
- Pick CSAT Best when you run many touchpoints (stores, clinics, service desks, support queues) and need to know which one is letting customers down. It's also the better choice when customers haven't known you long enough to judge the whole brand.
- Pick NPS Best when leadership wants one loyalty number to track quarter over quarter, or you want to benchmark against competitors. Because NPS is standardized, your +35 means the same thing as anyone else's.
- Pick both Best when you want to know where to fix things and whether those fixes are paying off in loyalty. Most mature feedback programs end up here.
One caveat: NPS doesn't suit every setting. Asking “Would you recommend us?” makes sense for a restaurant or a software product. It makes a lot less sense at the DMV, where nobody chooses where to renew their license. In settings like that, CSAT gives you a far more useful read.
When to Use NPS vs CSAT Surveys
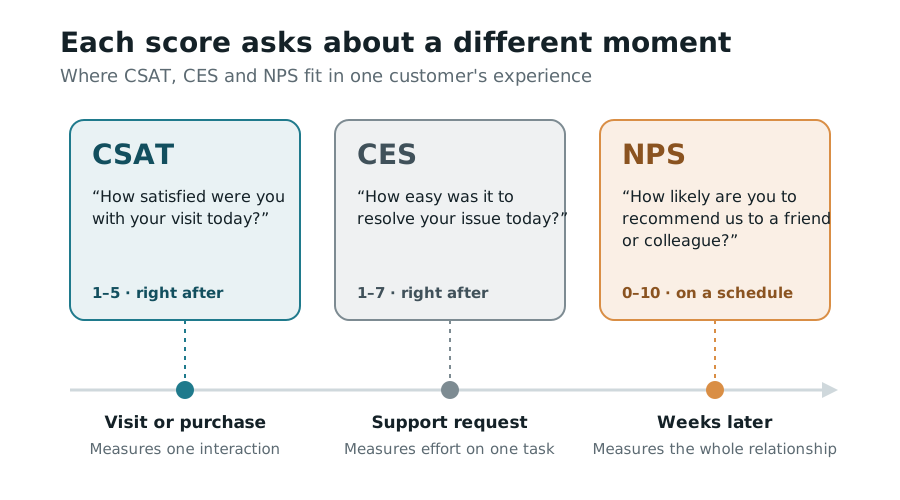
Timing matters as much as the metric. A simple rule: ask CSAT close to the moment, and ask NPS on a schedule.
| Moment | Metric to use | Why |
|---|---|---|
| Right after a visit or purchase | CSAT | The details are still fresh, so the answer reflects that visit. |
| After a support call or chat | CSAT or CES | You're rating one interaction, and effort is often the real issue. |
| Every quarter or twice a year | NPS | A steady schedule turns the score into a trend you can track. |
| After onboarding or a renewal | NPS | It checks whether the relationship is heading in the right direction. |
| At a physical location | CSAT, with NPS as an optional second question | People answer in seconds on their way out. |
CSAT vs NPS vs CES
Customer Effort Score (CES) is the third metric that often comes up in this debate. It asks how easy it was to get something done, usually right after a support interaction: “How easy was it to resolve your issue today?” Some teams phrase it as a statement to agree or disagree with, such as “The company made it easy for me to handle my issue.”
CES comes from research by CEB (now part of Gartner), published in Harvard Business Review in 2010, which found that reducing customer effort did more for loyalty than trying to delight customers. It's usually scored on a 1–7 scale, either as an average or as the percentage of people who agree.
| Metric | Asks about | Scale | Best time to ask |
|---|---|---|---|
| CSAT | Satisfaction with one interaction | 1–5 | Right after a visit, purchase or conversation |
| NPS | Likelihood to recommend you | 0–10 | On a regular schedule |
| CES | How easy something was | 1–7 | Right after a support request or task |
Use CES when effort is the problem you're trying to solve, such as a returns process, a billing question or a self-service portal. For most in-person experiences, CSAT covers the same ground with a simpler question.
Combining CSAT and NPS in One Survey
Because a single score hides so much, the most useful setup pairs it with one short follow-up question. Here's a simple structure that captures NPS and the reason behind it. Conditional logic means each customer only sees the follow-up that applies to them:
- Question 1 How likely is it that you would recommend us to a friend or colleague? (0–10)
- If the score is 0–6 What caused your poor experience? Wait time was too long / Service was poor / Too expensive
- If the score is 9–10 What did you like most? Service / Product / Value
Passives (7–8) can go straight to a thank-you screen or see either follow-up. Either way, you get a benchmarkable NPS plus a CSAT-style breakdown of what's driving it, in two taps.
SurveyStance supports this kind of branching on every survey type. Pair it with real-time alerts and someone can follow up with an unhappy customer the same day. That last step, closing the feedback loop, is where most of the value comes from.
CSAT or NPS on a Feedback Kiosk?
We get asked this a lot, and our answer is usually CSAT first. A row of five smiley faces takes a couple of seconds to answer, needs no reading and works for every age. An 11-button scale, ranging from 0–10, asks people to weigh a 6 against a 7 while they're walking out the door. While NPS has its place, we believe it's too many options for a quick survey.
Timing is the other reason. A kiosk catches people seconds after the experience, which is exactly the moment CSAT was built for. It also fixes the problem most email surveys have: instead of hearing mostly from the very happy and the very angry, you hear from the quiet middle too.
NPS still has a place on a kiosk, especially if leadership already reports it. If you need it, make it the only required question and keep the follow-up optional. Our NPS survey kiosk is set up for exactly that.
CSAT vs NPS FAQ
- When should I use NPS vs CSAT surveys? Use CSAT right after a specific interaction to find out how it went, and NPS on a regular schedule to track how customers feel about your brand overall. If you can only run one, CSAT tends to suit operations teams fixing day-to-day problems, while NPS suits leadership tracking long-term loyalty.
- CSAT vs NPS: which metric should we prioritize? Prioritize the one tied to the decisions you make most often. Teams running stores, clinics or support desks usually get more from CSAT because it points to a specific fix. Companies focused on retention and referrals usually lead with NPS. Plenty of teams run CSAT continuously and NPS once a quarter.
- Can you use CSAT and NPS together? Yes, and most teams should. Run CSAT at key touchpoints, ask the NPS question on a regular schedule for the big picture, and add a follow-up question to either one so you learn why people answered the way they did.
- Is NPS a type of CSAT? Not exactly. CSAT is a broad family of satisfaction questions, while NPS is one specific, standardized question about how likely someone is to recommend you. They're often grouped together because both come from short customer surveys.
- What's the difference between CSAT, NPS and CES? CSAT measures satisfaction with an interaction, NPS measures loyalty to the brand, and CES measures how easy it was to get something done. CSAT and CES work best right after an interaction, while NPS works best on a regular schedule.
- How often should you measure NPS? Quarterly or twice a year works for most companies. Surveying the same customers too often wears them out and adds noise without telling you much new.
FEEDBACK PROGRAMS
Turn this research into a live feedback program.
Compare kiosk, QR code, email signature, and OneClick feedback options built for faster response and real-time visibility.
Discover AI employee feedback surveys for real-time insights in 2026. Boost employee engagement with tools like SurveyStance.

Automated customer experience tells you an interaction happened, not that it worked. Gartner found customers are 3x more likely to use ChatGPT than your chatbot.
Discover the best cafeteria feedback survey solutions to gather actionable employee feedback. Improve dining experiences with a modern feedback survey kiosk.