Sample reports and dashboards

Reports and Dashboards Sample Data

SurveyStance reporting helps teams understand feedback quickly, review trends, and stay close to customer and employee sentiment.

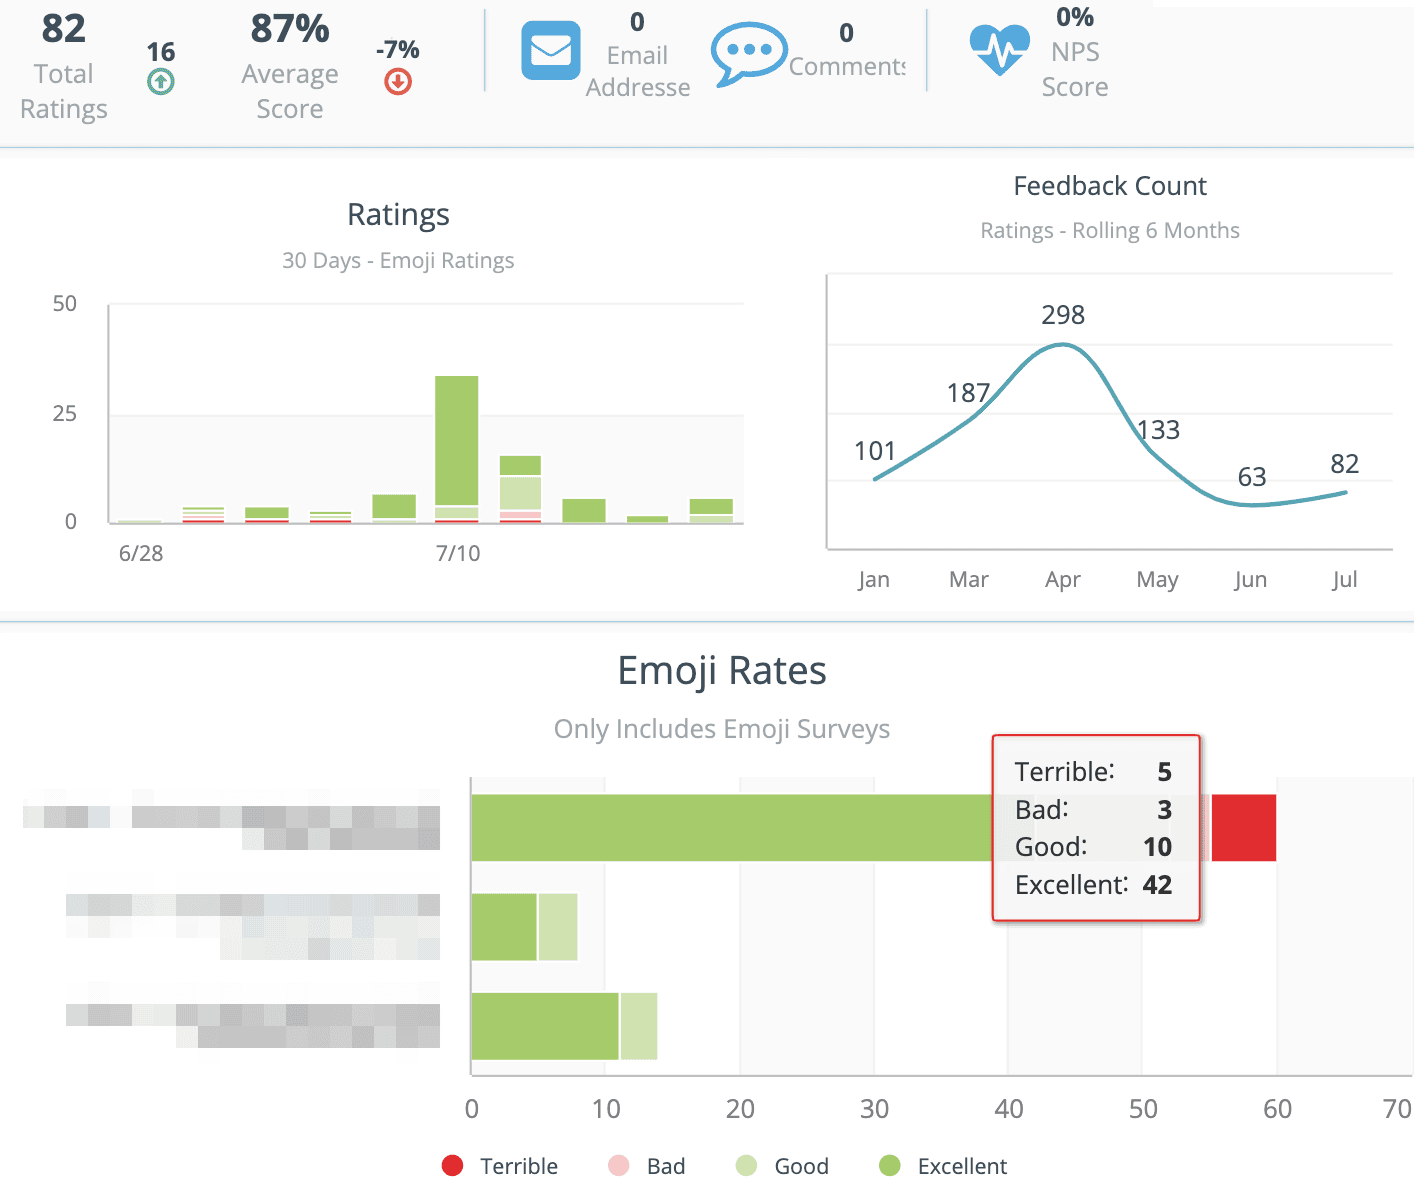
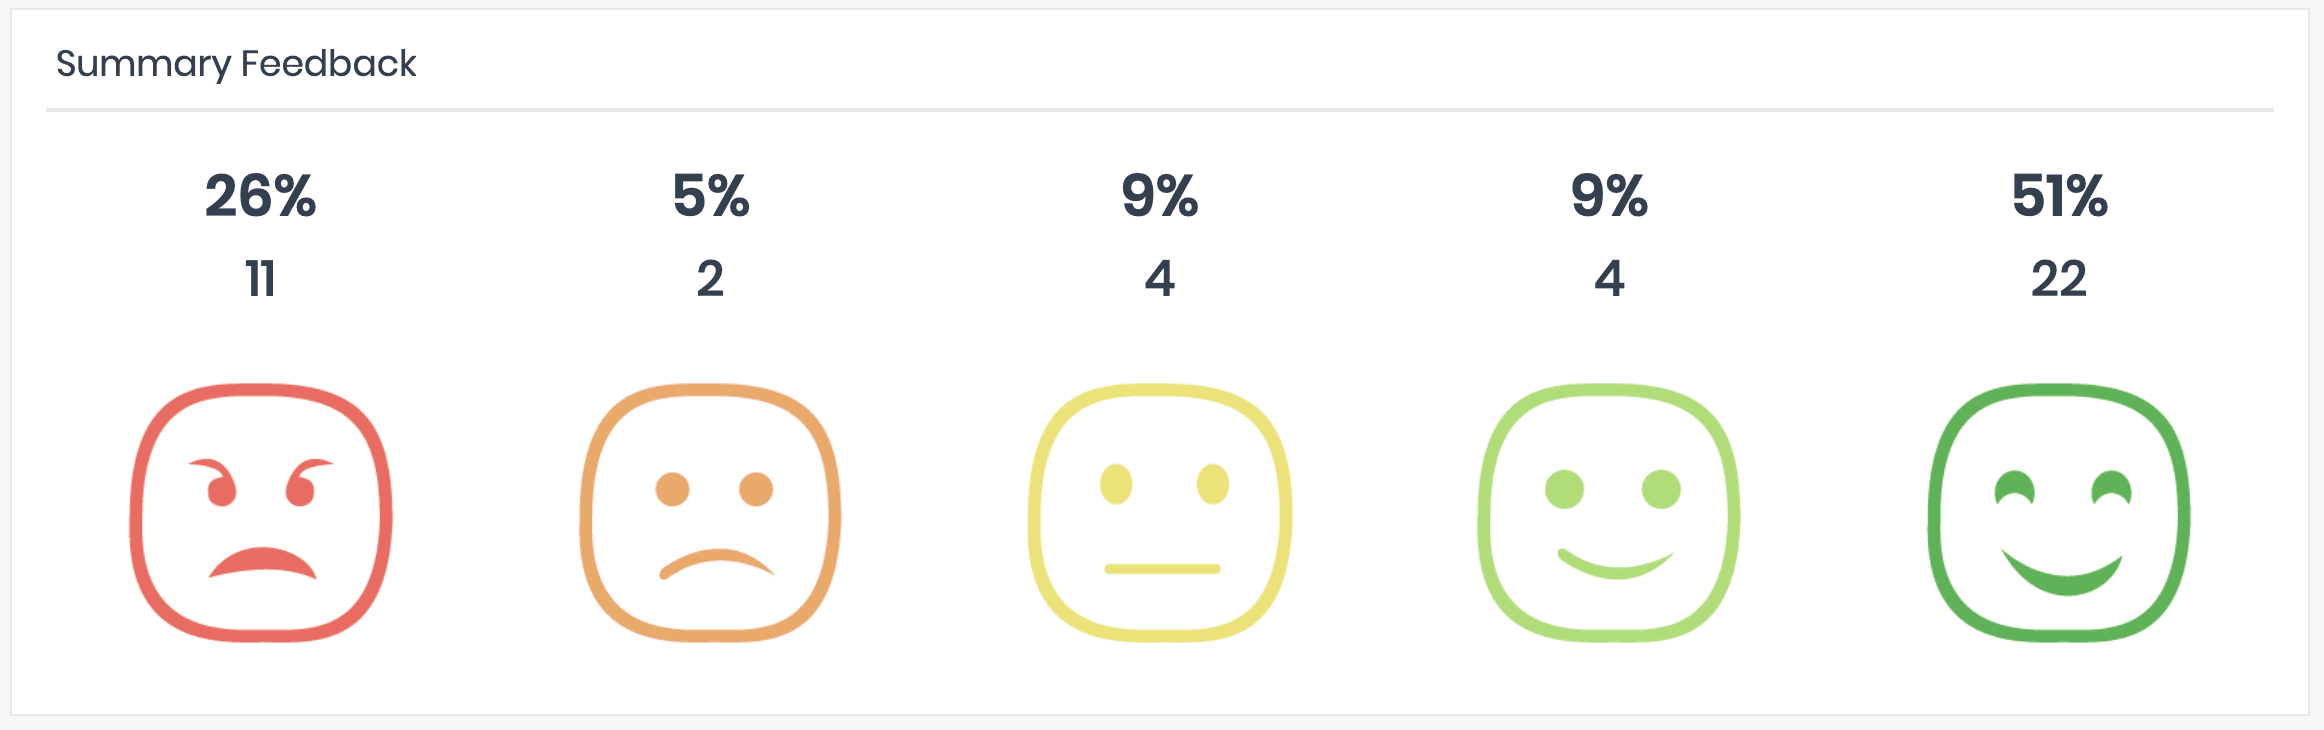
SurveyStance Feedback Dashboard showing total rates, average score, positive and negative rates, a score trend chart, and a sentiment mix breakdown
Live feedback visibility Dashboard, summaries, and trend reporting

Reporting portal

Customer Feedback Dashboard & Reporting

SurveyStance Feedback Dashboard is available 24/7 within your Admin Portal. Weekly and Monthly automated reports are available to schedule directly to your email inbox as well.

Available 24/7 within your Admin Portal

Weekly and Monthly automated reports

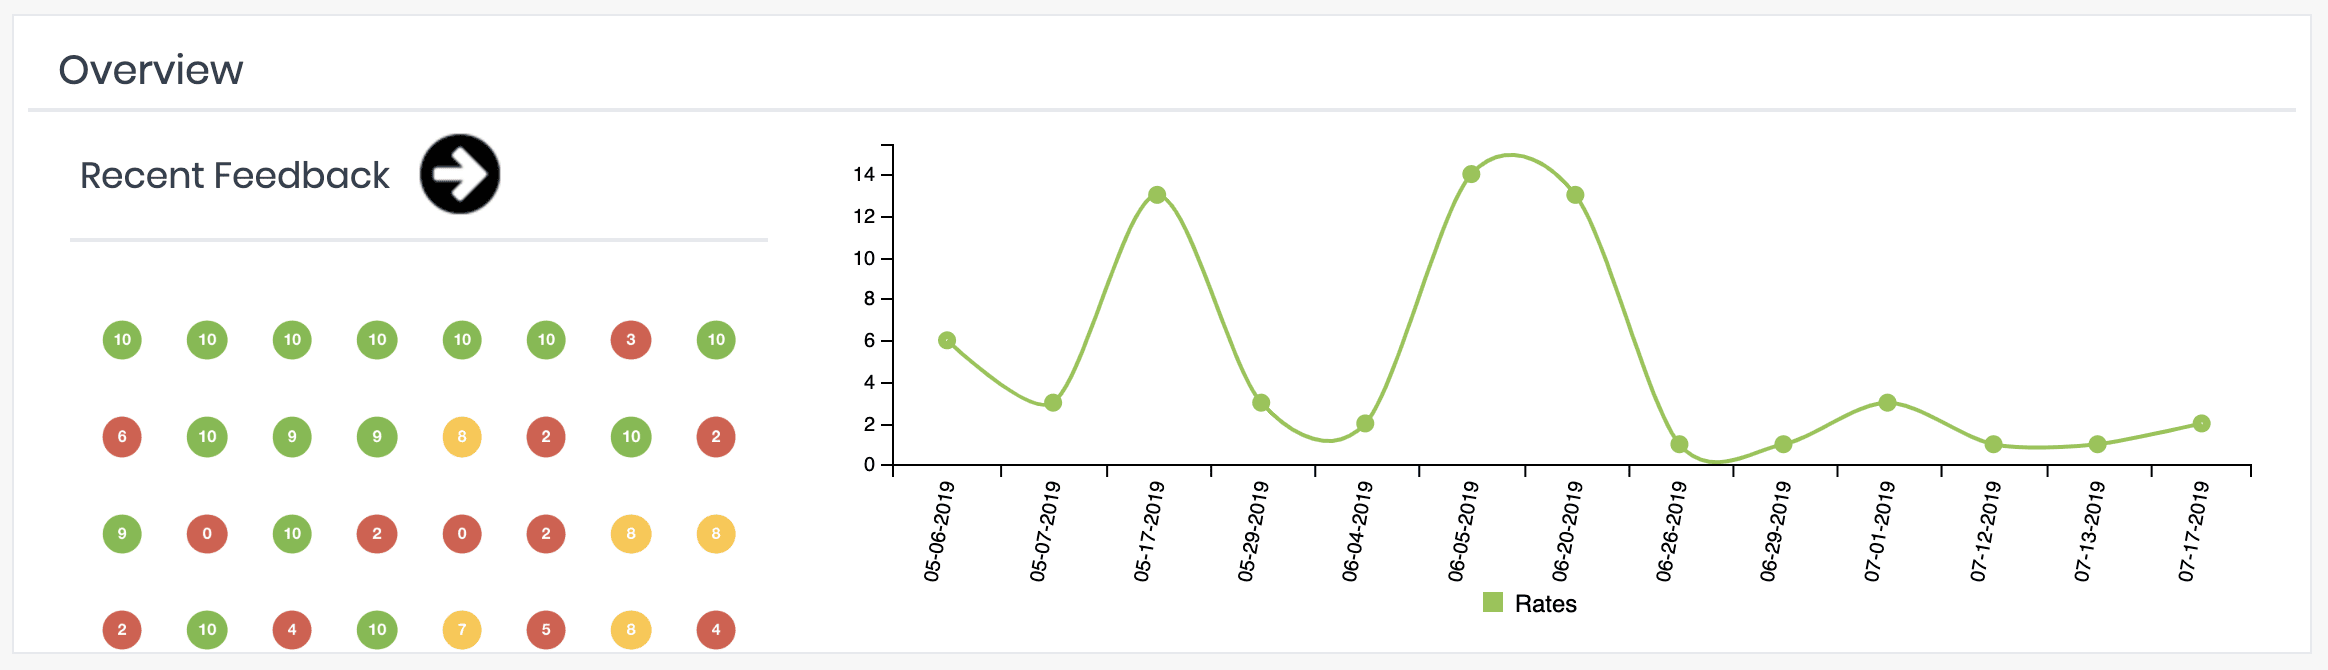
Simple overview with deeper drilldowns

Export feedback data into usable reports

Highlight strip showing 1,248 total rates, an 87.4% average score, 1,046 positive rates, and 68 negative rates for the week

At-a-glance view

Summary Overview

Simplistic overview makes it easy to understand. Drill down to more complex reports as needed.

Fast executive review Clear positive and negative trends Built for repeat visibility
Feedback result summary showing an 87.4% average score ring alongside survey sessions, questions answered, average completion time, QR responses, and alerts sent

Custom reporting

Custom Reports & Dashboards

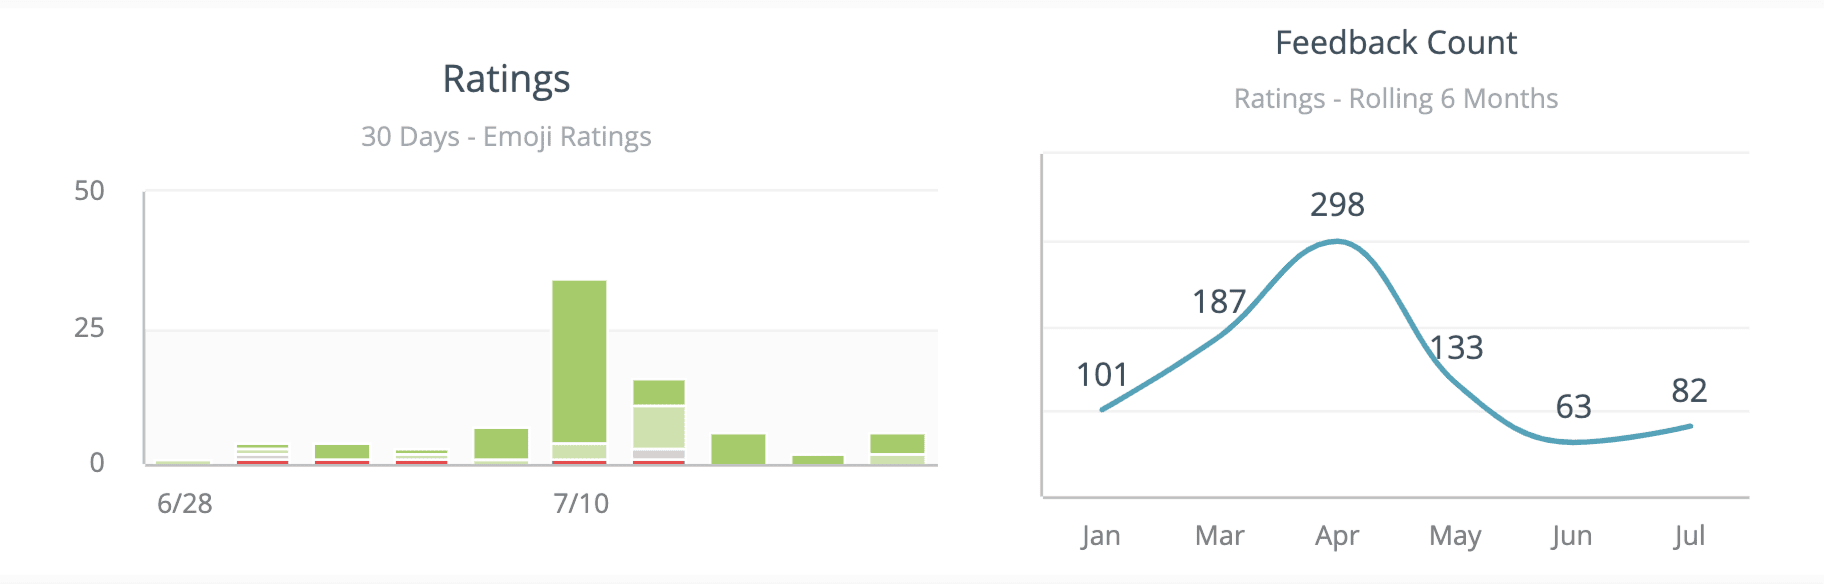
Track Key Metrics -Overall Ratings -Average Score -NPS -Trending Month over Month.

Kiosk comparison report ranking six locations by average score against an 85% target line, with the week's top and lowest performers called out

See it with your data

Review the dashboard before choosing a feedback channel.

A short demo can show how kiosk, QR code, OneClick, and email signature responses flow into the SurveyStance reporting portal.